I built it myself. I used an optoisolator to convert the sine wave of AC power to a series of pulses, and also for safety reasons (it communicates data over light pulses, so that the mains power circuit is completely electrically isolated from the stuff I might touch). Then I used a microcontroller to precisely time the deviation from 50Hz, and output a serial port via MAX232. A desktop computer logs the data and gives me a real-time graph of the deviation. I might have some sample files lying around somewhere.
The microcontroller (ATMEGA16) ran at 20MHz using a crystal oscillator, and with some slightly funky tradeoffs, I was able to get a time resolution of 50 nanoseconds with an error of about 20 parts per million. If it deviates too far from 50Hz, I get nonsense measurements due to the tradeoff though (I trade measurement range for precision).
The original idea was to analyze tiny variations in phase at extremely short time scales to use the mains power transmission lines as a sort of large antenna array. Then use that to study space weather (e.g. solar wind, flares, etc.) more cheaply than sending up satellites. As a hardened skeptic, I originally built it as an elaborate practical joke due to all those ‘Mayan Calendar Doomsday 2012’ folks. You see if the world did end, I would have been in a position of absolutely dreadful embarrassment. So I built it as a sort of ‘doomsday detector’.
Sadly, that component of the project never worked. I ran it during some solar activity peaks, and was unable to correlate the measurements taken by satellites to anything I found. It does still allow some weird things though, like I can apparently create a phase variance ‘fingerprint’ and use that to conclude whether a video was recorded in my city, and at what time. I’ve heard of some people doing that to youtube videos.
I can also get an idea of the power draw of the city I’m in. As people draw more power, the phase drops, then the power authority turns more turbines on. When the load lightens, the phase goes up, and I can see those turbines being turned off. This is sort of fun to turn on and watch if you get home early, you can see everyone else getting home and turning stuff on.


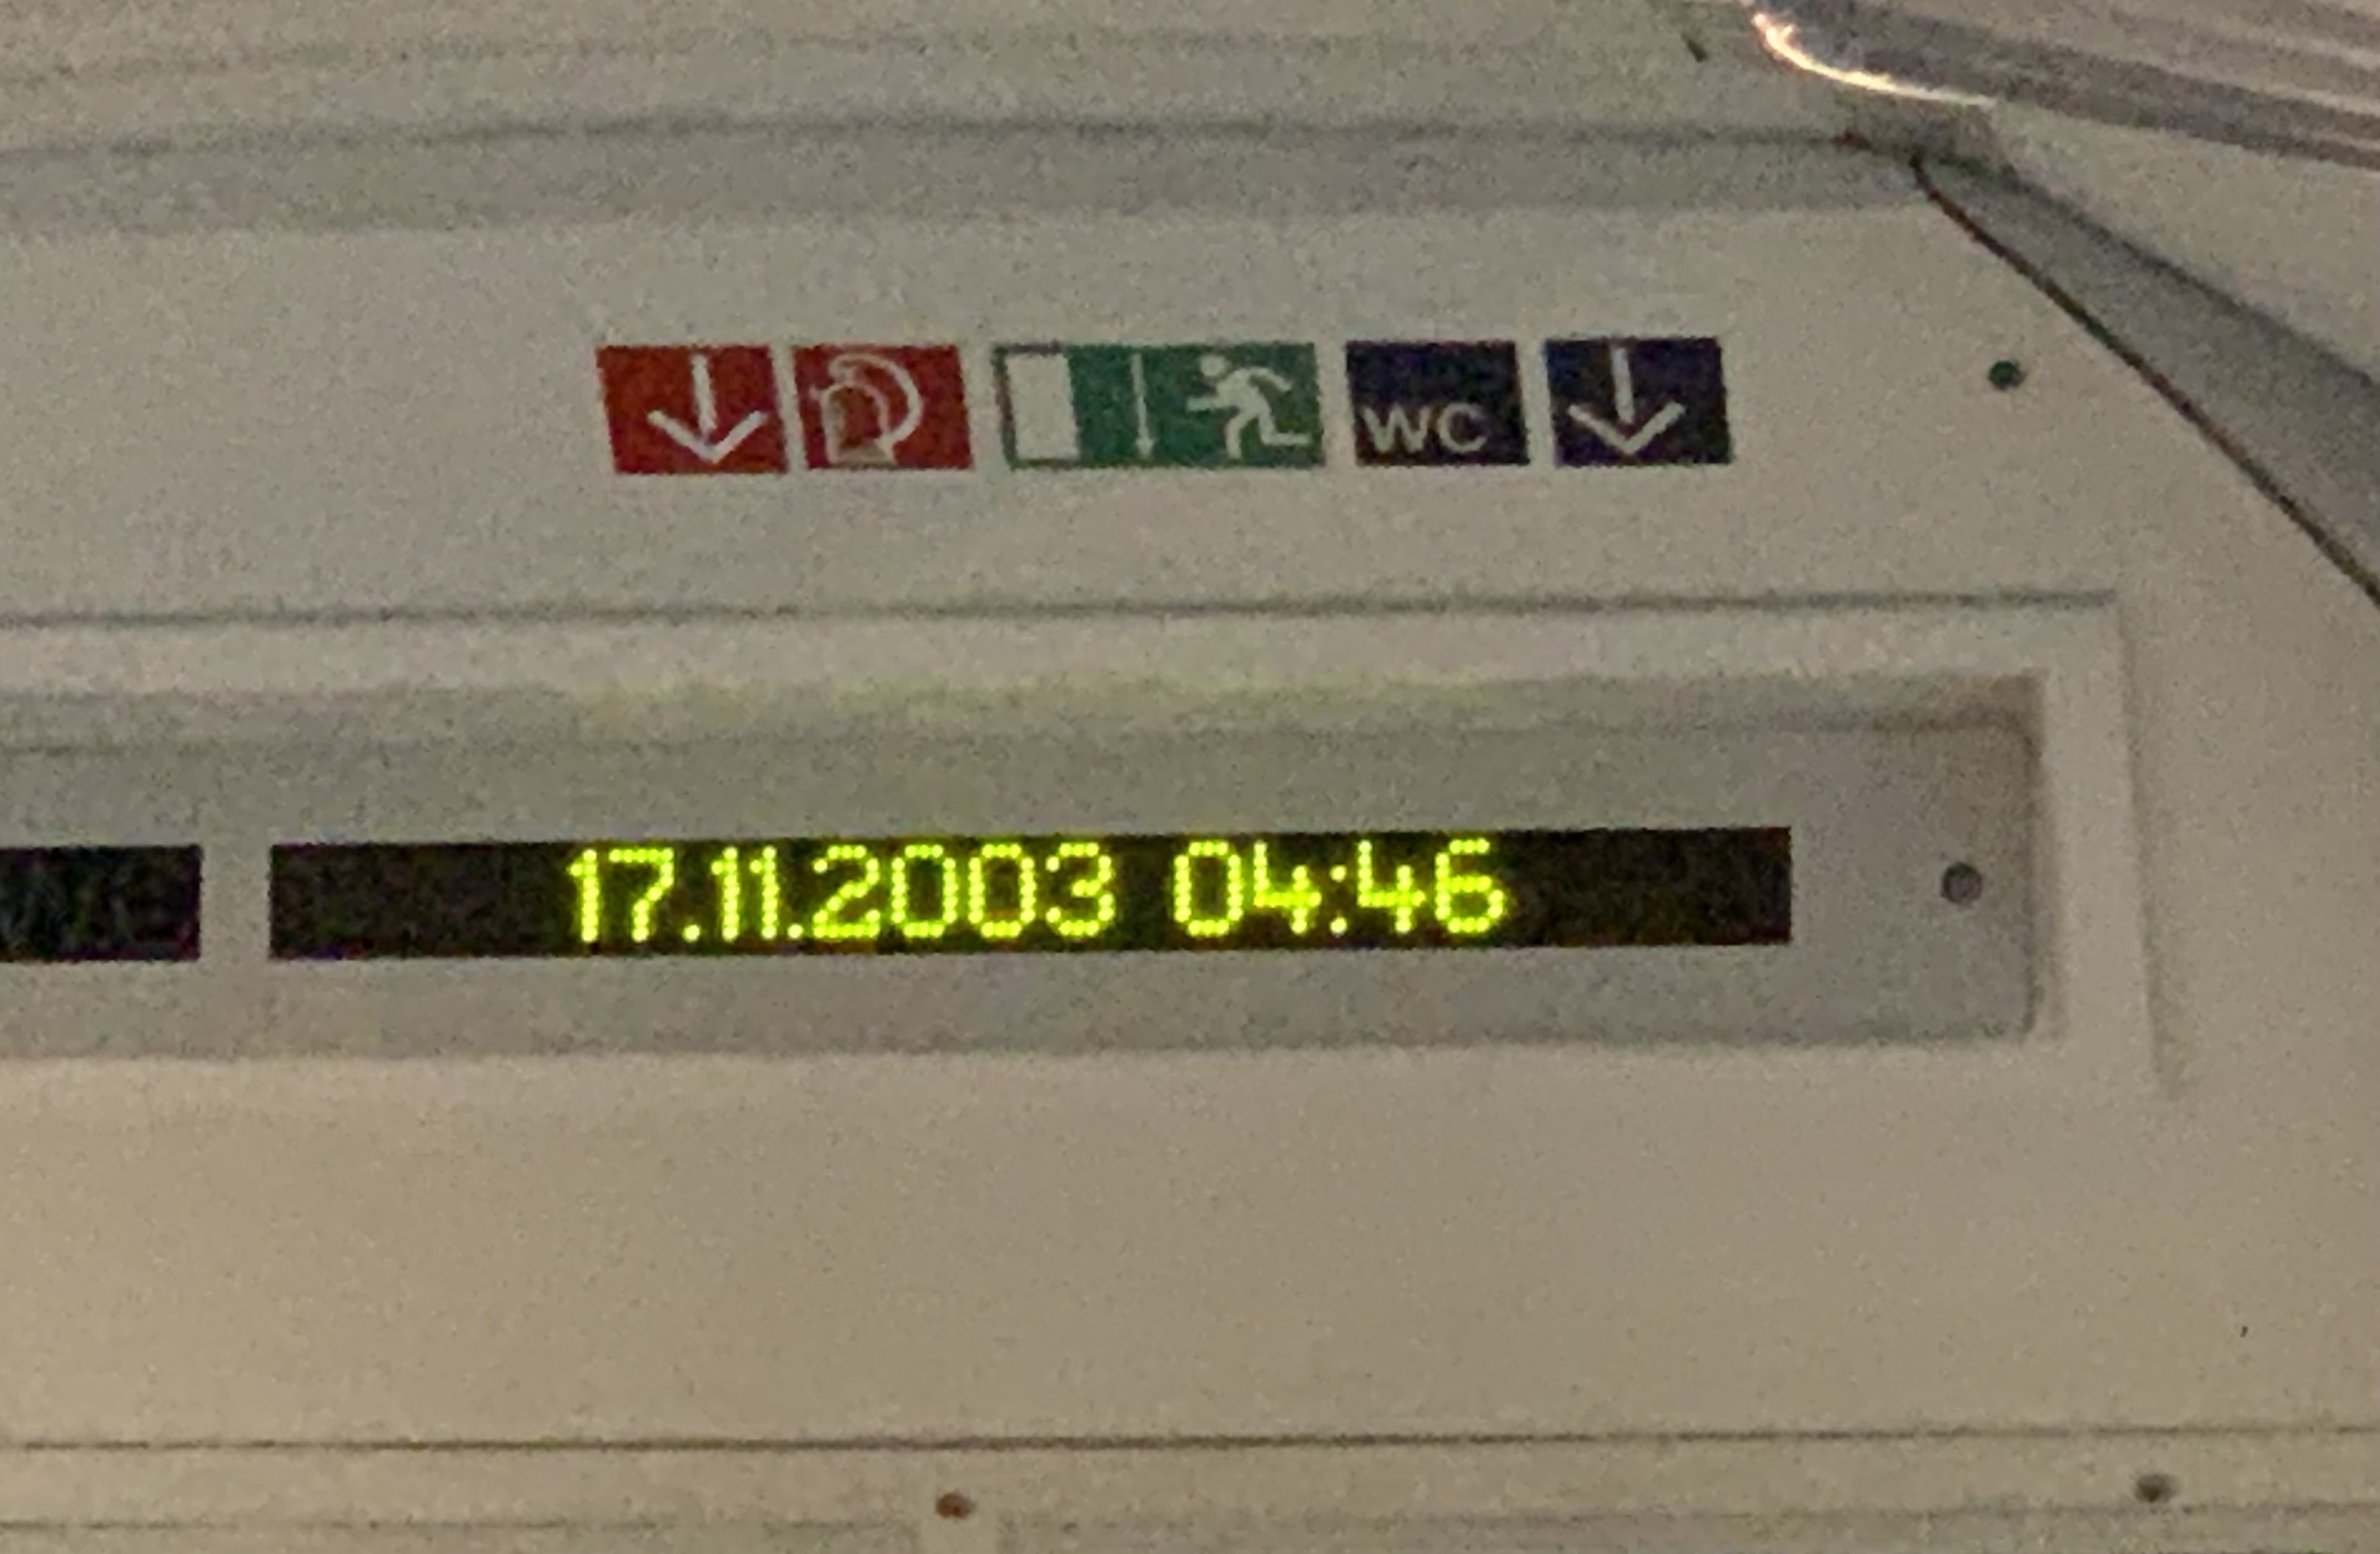
This is a train’s clock, though. And since these displays also show additional information, I guess there’s a bit more sophistication behind it.
Did you construct the analyzer yourself or can you buy that off shelf?
I built it myself. I used an optoisolator to convert the sine wave of AC power to a series of pulses, and also for safety reasons (it communicates data over light pulses, so that the mains power circuit is completely electrically isolated from the stuff I might touch). Then I used a microcontroller to precisely time the deviation from 50Hz, and output a serial port via MAX232. A desktop computer logs the data and gives me a real-time graph of the deviation. I might have some sample files lying around somewhere.
The microcontroller (ATMEGA16) ran at 20MHz using a crystal oscillator, and with some slightly funky tradeoffs, I was able to get a time resolution of 50 nanoseconds with an error of about 20 parts per million. If it deviates too far from 50Hz, I get nonsense measurements due to the tradeoff though (I trade measurement range for precision).
The original idea was to analyze tiny variations in phase at extremely short time scales to use the mains power transmission lines as a sort of large antenna array. Then use that to study space weather (e.g. solar wind, flares, etc.) more cheaply than sending up satellites. As a hardened skeptic, I originally built it as an elaborate practical joke due to all those ‘Mayan Calendar Doomsday 2012’ folks. You see if the world did end, I would have been in a position of absolutely dreadful embarrassment. So I built it as a sort of ‘doomsday detector’.
Sadly, that component of the project never worked. I ran it during some solar activity peaks, and was unable to correlate the measurements taken by satellites to anything I found. It does still allow some weird things though, like I can apparently create a phase variance ‘fingerprint’ and use that to conclude whether a video was recorded in my city, and at what time. I’ve heard of some people doing that to youtube videos.
I can also get an idea of the power draw of the city I’m in. As people draw more power, the phase drops, then the power authority turns more turbines on. When the load lightens, the phase goes up, and I can see those turbines being turned off. This is sort of fun to turn on and watch if you get home early, you can see everyone else getting home and turning stuff on.