I should add that this isn’t the first time this has happened, but it is the first time since I reduced the allocation of RAM for PostgreSQL in the configuration file. I swore that that was the problem, but I guess not. It’s been almost a full week without any usage spikes or service interruptions of this kind, but all of a sudden, my RAM and CPU are maxing out again at regular intervals. When this occurs, the instance is unreachable until the issue resolves itself, which seemingly takes 5-10 minutes.

The usage spikes only started today out of a seven-day graph; they are far above my idle usage.
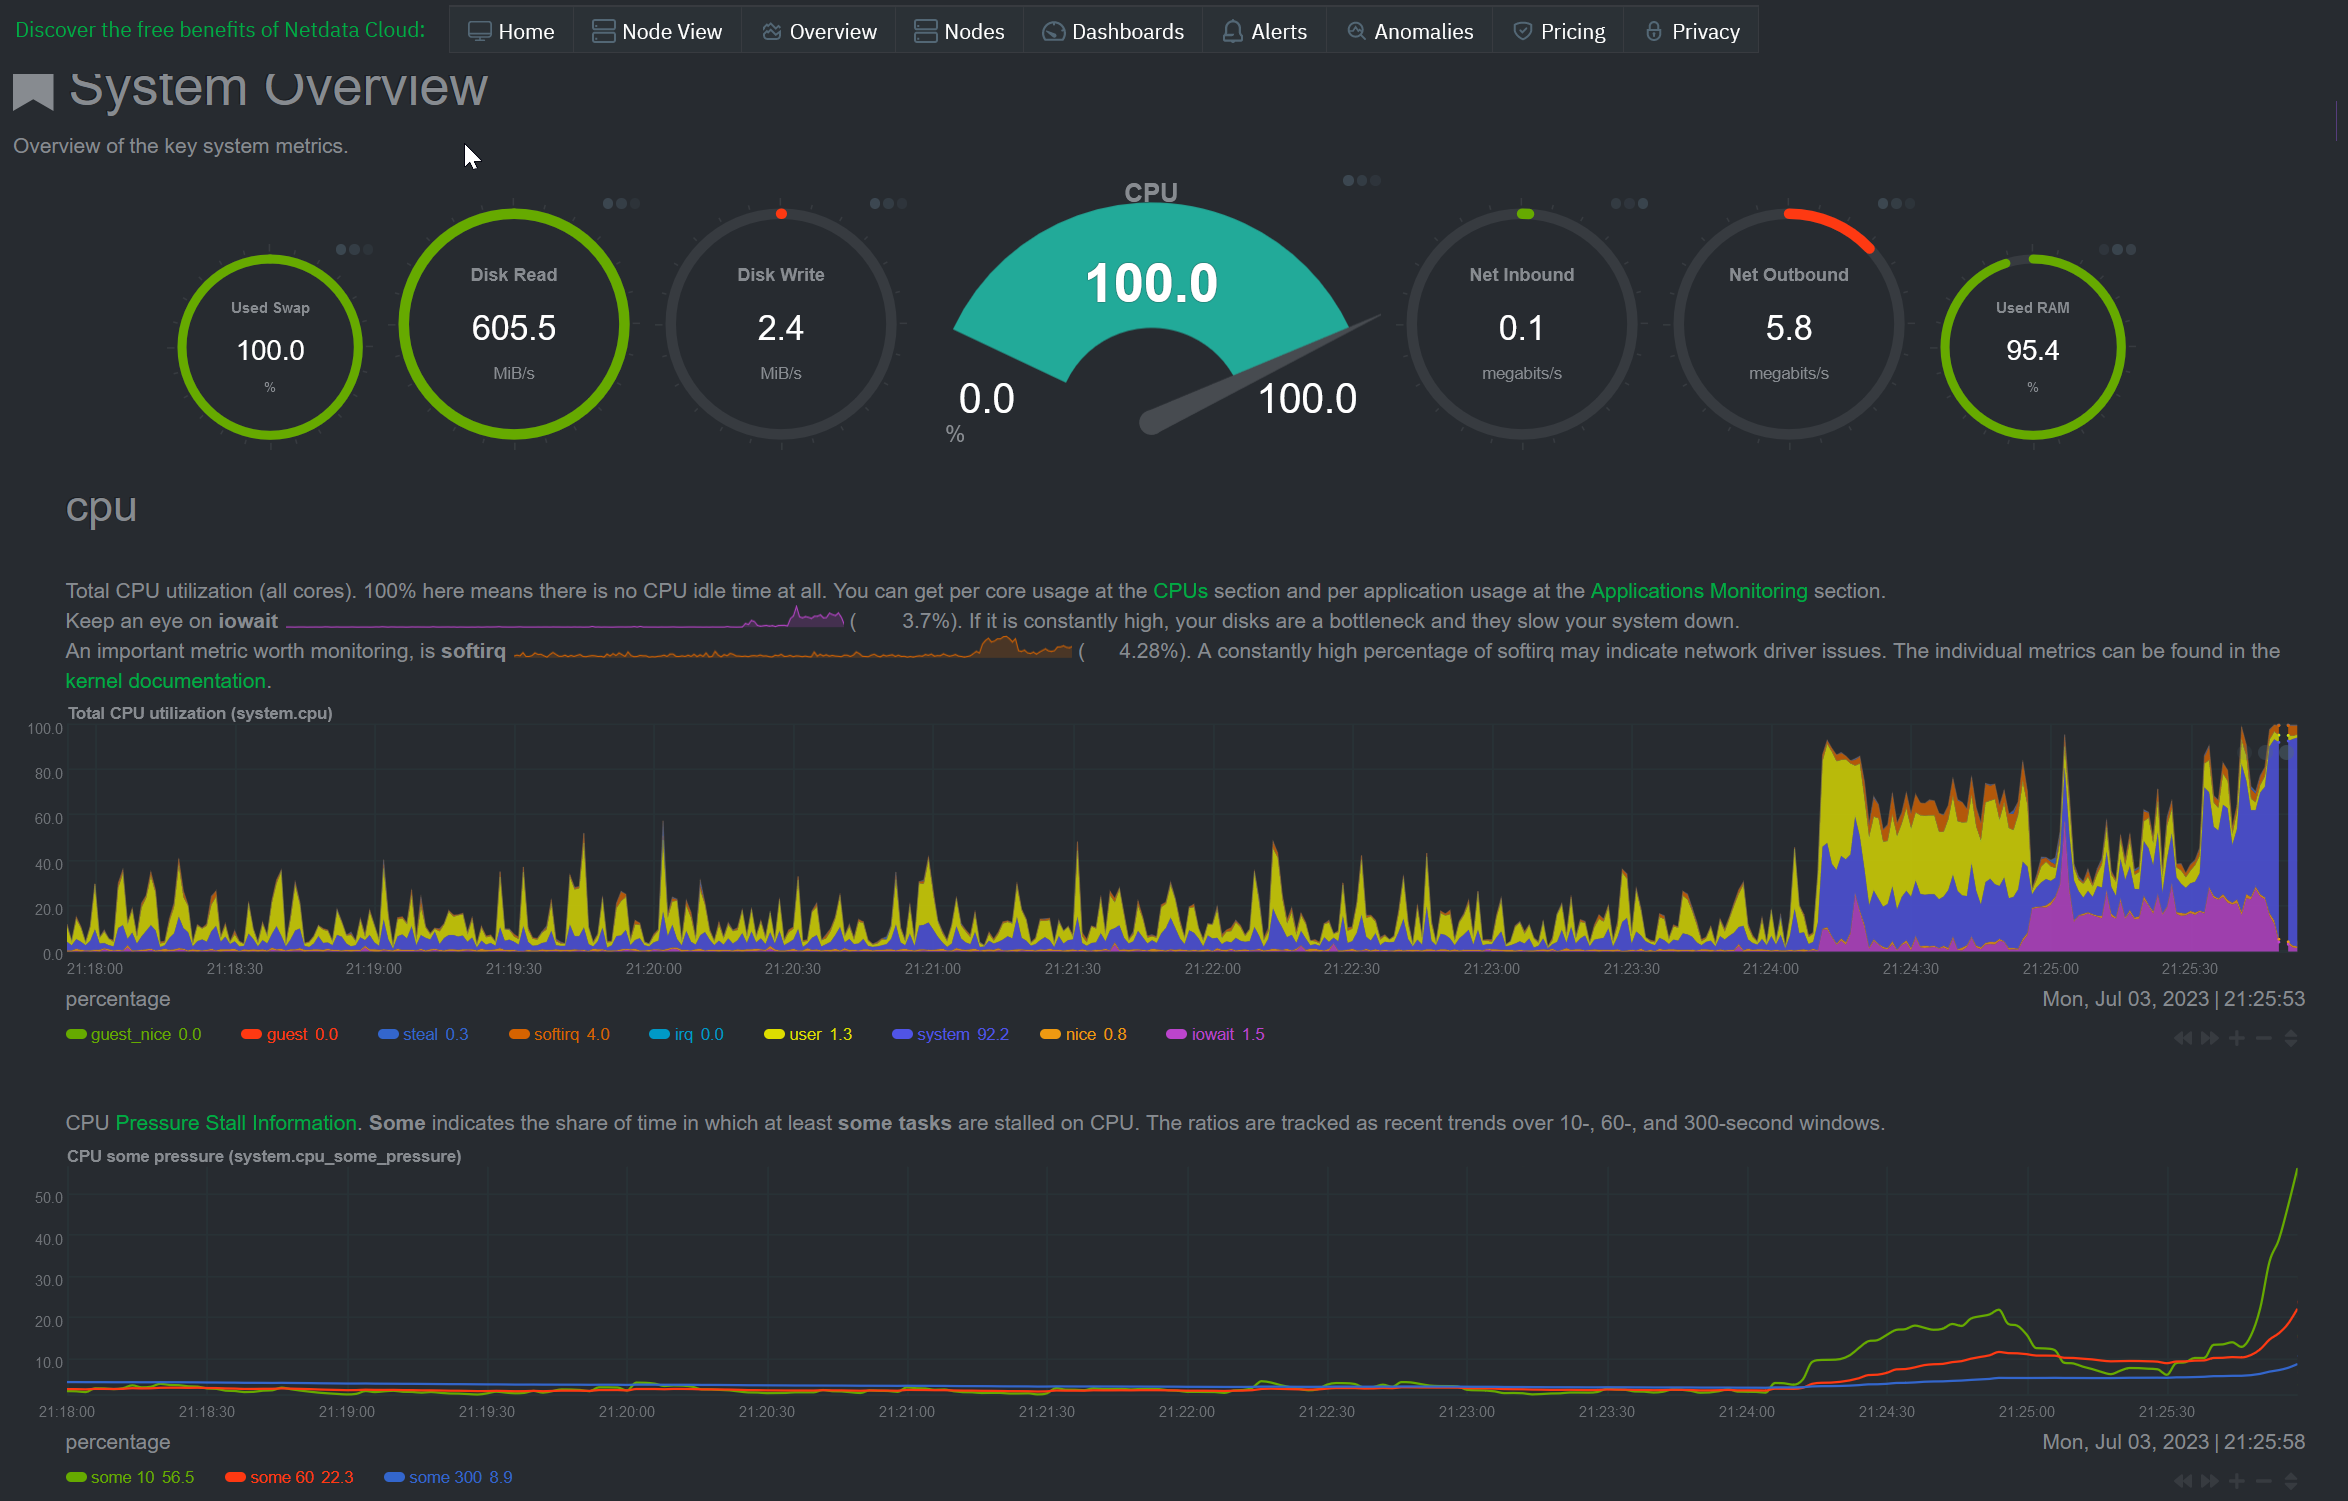
I thought the issue was something to do with Lemmy periodically fetching some sort of remote data and slamming the database, which is why I reduced the RAM allocation for PostgreSQL to 1.5 GB instead of the full 2 GB. As you can see in the above graph, my idle resource utilization is really low. Since it’s probably cut off from the image, I’ll add that my disk utilization is currently 25-30%. Everything seemed to be in order for basically an entire week, but this problem showed up again.
Does anyone know what is causing this? Clearly, something is happening that is loading the server more than usual.
Depending on your timezone, it is possibly a peak in traffic from the US, an overlap of July 4th, Reddit userbase jumping in, and the recent surge on shitposting about…sigh… beans.
This issue occured a few weeks ago as well, even when we had very little traffic. We still have peanuts when compared with other instances.

interesting my new instance just had a 10ish minute cpu spike where ir was unresponsive. Even following a reboot.
Yeah, mine have technically happened after reboots, although things typically take a few days at least for the problem to creep up. This past time, I basically have a whole entire week in before things went to crap.
Oh, and for completeness:
-
We’ve deleted the vast majority of the spam bots that spammed our instance, are currently on closed registration with applications, and have had no anomalous activity since.
-
Our server is essentially always at 50% memory (1GB/2GB), 10% CPU (2 vCPUs), and 30% disk (15-20GB/60GB) until a spike. Disk utilization does not change during a spike.
-
Our instance is relatively quiet, and we probably have no more than ten truly active users at this point. We have a potential uptick in membership, but this is still relatively slow and negligible.
-
This issue has happened before, but I assumed it was fixed when I changed the PostgreSQL configuration to utilize less RAM. This is still the longest lead-up time before the spikes started.
-
When the spike resolves itself, the instance works as expected. The issues with service interruptions seems to stem from a drastic increase in resource utilization, which could be caused by some software component that I’m not aware of. I used the Ansible install for Lemmy, and have only modified certain configuration files as required. For the most part, I’ve only added a higher max_client_body_size in the nginx configs for larger images, and have added settings for an SMTP relay to the main config.hjson file. The spikes occured before these changes, which leads me to believe that they are caused by something I have not yet explored.
-
These issues occured on both 0.17.4 and 0.18.0, which seems to indicate it’s not a new issue stemming from a recent source code change.
-
I’ve been seeing similar since upgrading to 0.18. Upgraded to 0.18.1-rc.9 yesterday… haven’t seen it reoccur again… yet.
Here is an example I happened to be at my PC for:
The problem is that an update will inherently involve a restart of everything, which tends to solve the problem anyway. Whether the update fixed things or restarting things temporarily did is only something you can find out in a few days.
Yeah, I’ve gone over 24 hours now without it occurring… but not calling it “fixed” until at least a week.
Here’s an update. I set up atop on my VPS and waited until the issue occurred again. Here’s the atop log from the event.
ATOP - ip-172-31-7-27   2023/07/22  18:40:02   -----------------   10m0s elapsed
PRC | sys    9m49s | user  12.66s | #proc    134 | #zombie    0 | #exit      3 |
CPU | sys      99% | user      0% | irq       0% | idle      0% | wait      0% |
MEM | tot   957.1M | free   49.8M | buff    0.1M | slab   95.1M | numnode    1 |
SWP | tot     0.0M | free    0.0M | swcac   0.0M | vmcom   2.4G | vmlim 478.6M |
PAG | numamig    0 | migrate    0 | swin       0 | swout      0 | oomkill    0 |
PSI | cpusome  63% | memsome  99% | memfull  88% | iosome   99% | iofull    0% |
DSK |         xvda | busy    100% | read  461505 | write    171 | avio 1.30 ms |
DSK |        xvda1 | busy    100% | read  461505 | write    171 | avio 1.30 ms |
NET | transport    | tcpi    2004 | tcpo    1477 | udpi       9 | udpo      11 |
NET | network      | ipi     2035 | ipo     1521 | ipfrw     20 | deliv   2015 |
NET | eth0    ---- | pcki    2028 | pcko    1500 | si    4 Kbps | so    1 Kbps |

    PID SYSCPU USRCPU  VGROW  RGROW  RDDSK  WRDSK  CPU CMD
     41  5m17s  0.00s     0B     0B     0B     0B  53% kswapd0
      1 21.87s  0.00s     0B -80.0K   1.2G     0B   4% systemd
  21681 20.28s  0.00s     0B   4.0K   4.2G     0B   3% lemmy
    435 18.00s  0.00s     0B 392.0K 163.1M     0B   3% snapd
  21576 17.20s  0.00s     0B     0B   4.2G     0B   3% pict-rs
The culprit seems to be kswapd0 trying to move memory to swap space, although there is no swap space.
I set memory swappiness to 0 on the system for now, I’ll check if that makes a difference.
Tbh, I haven’t really had this issue in a few weeks. I’m tempted to think it’s usage-related, and could possibly indicate that my memory allocation for the DB is still too high.
I’m having similar issues with my instance where I’m the only one on it. I allocated more RAM to it now to see if it does anything.
I did that a while ago, and unfortunately, it didn’t really help. I don’t think it’s an issue of RAM, but rather a daemon or something periodically going nuclear with resource utilization. A configuration issue, perhaps?
Sounds more like it, yes. I’ll keep an eye on it.
Maybe we should create a post in the support community?
You can if you want. Reply here with the link if you do (or mention me if that’s a thing on Lemmy).
I’ve limited the resources available to Lemmy and pictrs and will see if it helps.
I had the same thing happen. Max CPU usage, couldn’t even ssh in to fix it and had to reboot from aws console. Logs don’t show anything unusual apart from postgres restarting 30 minutes into the spike, possibly from being killed by the system.
You say yours solved itself in 10 minutes, mine didn’t seem to stop after 2 hours, so I reeboted. It could be that my vps is just 1 CPU, 1 GB RAM, so it took longer doing whatever it was doing.
Now I set up RAM and CPU limits following this question, and an alert so I can hopefully ssh in and figure out what’s happening when it’s happening.
Any suggestions on what I should be looking at if I manage to get into the system?
I’ll save this to look at later, but I did use PGTune to set my total RAM allocation for PostgreSQL to be 1.5GB instead of 2. I thought this solved the problem initially, but the problem is back and my config is still at 1.5GB (set in MB to something like 1536 MB, to avoid confusion).
I rebooted about 5 minutes into it. running a t2.micro instance but it went back into high cpu after reboot and I was still unable to ssh in for another 5 minutes. I just rebooted it again to be sure and it was available almost immediately.