
• 8 Posts
  • 71 Comments
Joined 1 year ago
cake
Cake day: October 12th, 2023

help-circle

  • It is most certainly not a small sample size. It’s what allows for a margin of error of ±3.5%* at the 95% confidence level. Here’s a graph of the margin of error vs sample size for 95% confidence interval.
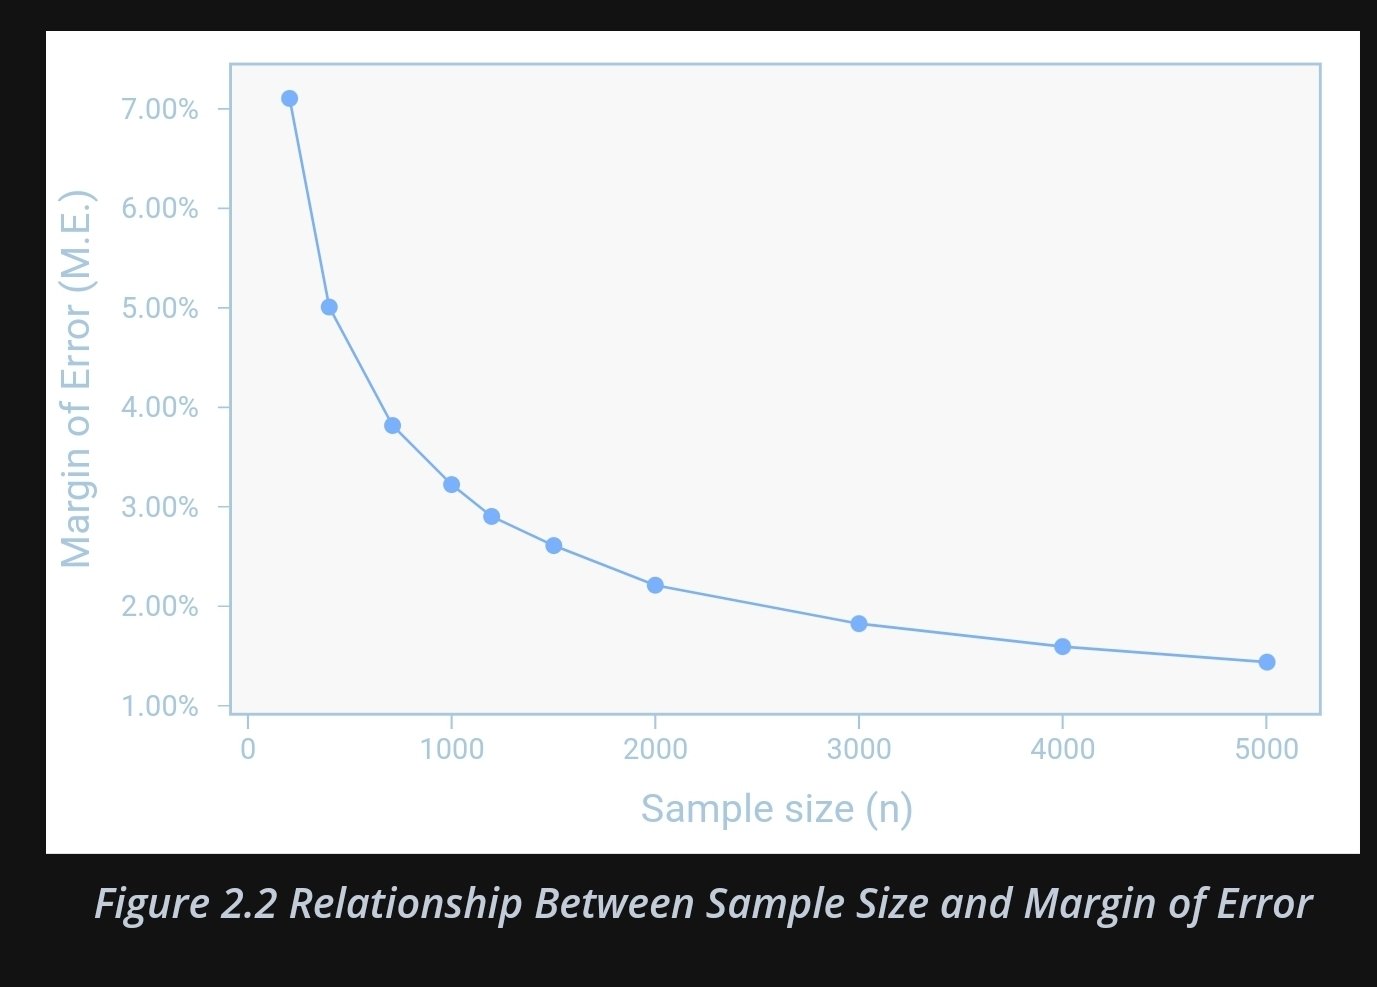
    With an 11 point margin, there’s a clear separation of the upper limit bar for Trump and lower limit bar for Obama. For a single poll, assuming the rest of it was well designed and executed, this is an important spread. And the reasons are obvious if you look at the report. She’s able to get 10% more Democratic support and 20% more independent voter support.

    Ipsos is a high quality polling company. They don’t make rookie mistakes like sample size. There may be other reasons beyond my reasoning that make this a bad use of polling, but sample size is not it.

    * The source incorrectly reported the margin of error for the full survey, both registered and unregistered participants.



  • I can’t think of worse debate performance. Nixon profusely sweating? Pretty bad, but at least he was coherent.

    Mondale not being able to counter Regan’s age deflecting quip? Damn. That’s so tough one when the crowds turned.

    The Gore eye roll? Well damn that sucks.

    But this was a debate long fugue state. At best, some Trump previous incoherent ramblings are close, but still not as bad.

    This was seriously bad. And everyone failing to see that and trying to minimize it is attempting and failing to gaslight everyone else.

    There maybe no replacement available, but at least call a spade a spade.


  • Here’s the source for that chart. And the paper for that chart.

    The chart is for household income. With each generation, there’s an increase in the percentage of the generation living at home. This is noted in the paper, but not in The Economist article. We’ll see if Gen Z makes the switch like Millennials were during their 30s.

    A couple of asides. The Economist graph isn’t very easily matched with one from the paper. There are several graphs that share similar contours, but The Economist has changed the aspect ratio enough that it’s hard to identify with visual inspection. Most curious, though, is The Economist’s choice of starting the x-axis at 15 years old. All the graphs in the paper start at 20myesrs old.

    The conclusion in The Economist piece is as follows:

    What does this wealth mean? It can seem as if millennials grew up thinking a job was a privilege, and acted accordingly. They are deferential to bosses and eager to please. Zoomers, by contrast, have grown up believing that a job is basically a right, meaning they have a different attitude to work. Last year Gen Z-ers boasted about “quiet quitting”, where they put in just enough effort not to be fired. Others talk of “bare minimum Monday”. The “girlboss” archetype, who seeks to wrestle corporate control away from domineering men, appeals to millennial women. Gen Z ones are more likely to discuss the idea of being “snail girls”, who take things slowly and prioritise self-care.

    It is clear that The Economist has an agenda of dividing Millennials and Gen Z. The paper makes no claims about Gen Z and their economic outlook. The data is simply not there. Rather, The Economist is recapitulating tired themes of “the youth these days” and “kids don’t want to work”.

    People work when they have something to work towards, with and for people they care about. People work hard because it fills us with meaning purpose. When we are young, we do and should be creating relationships and learning about ourselves, the world, who we wish to be in the world, and who we wish to journey with.

    I forever will call bullshit on the anti-youth themes of our culture. It dimishes it and serves only the most well established and crumudgenly amongst us. Articles like these have all too obvious subtext of “shut up, work hard, and grow up”.

    Fuck that noise.